Every paid surface under one profit strategy.
The channel isn’t the goal, it’s the tool. The question isn’t “Google or Meta”, but where the next unit of spend makes the most profit, and we decide that by measurement, not by habit.
Where your customers actually decide
Each can be booked on its own, but they deliver the most when they run under one shared measurement and one shared budget logic.
Google Ads
Search, Shopping, PMax, YouTube and Display, in the mix that pays back best.
Social media advertising
Meta, TikTok and LinkedIn, with layered targeting and creative built to be tested.
Microsoft (Bing) Ads
Less competition, often cheaper clicks, a desktop- and B2B-heavy audience.
ChatGPT Ads
The new ad surface of AI search, with an early-mover advantage.
CSS & price comparison
Google Shopping up to 20% cheaper, with people who are ready to buy.
Programmatic
Automated display and video on the open internet, with precise targeting.
Same budget. Different mix, different revenue.
Band width is money: monthly budget on the left, channels in the middle, revenue on the right. Switch the mix and watch it rearrange.
Not from habit, but from the numbers
In most accounts the problem isn’t that the channel is wrong, but that no one measures what each one is worth. First we look at how big the demand is, what it costs to reach it and what your margin is, then we allocate the budget.
- 01DemandIs there any active search for your product at all, or does demand need to be built first.
- 02Competition and cost per clickPer channel, in your market, not in an industry average.
- 03Margin and basket valueThis is what tells us how much CPA you can actually afford.
- 04Measurement maturityWhat we can credibly measure back, without it we’re bidding blind.
- 05CapacityHow much creative we can realistically deliver month after month.
Does a high ROAS really mean profit?
Three sliders and you’ll know. The red line is break-even: if your ROAS is below it, every sale generates a loss.
Simplified: excludes shipping, warehousing and wages.
One measurement, one budget, one decision logic
Shared measurement
Server-side tracking and clean attribution, so it isn’t the platforms’ own self-reporting that decides.
A moving budget
The budget isn’t tied to channels: it goes where the marginal return is best at any given time.
One report
A single business report across all surfaces, not six different dashboards.
We don’t invent the ratios: your margin and the measured return decide how much goes to each surface.
Figures from our own accounts, not industry averages.
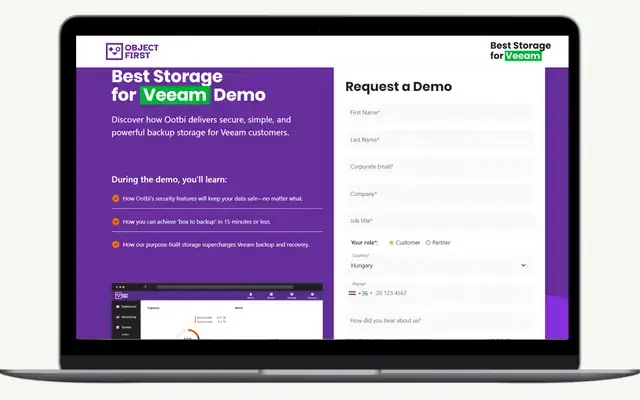

Object First
+135% leads and a 32% lower CPA with a redesigned account architecture
Case study →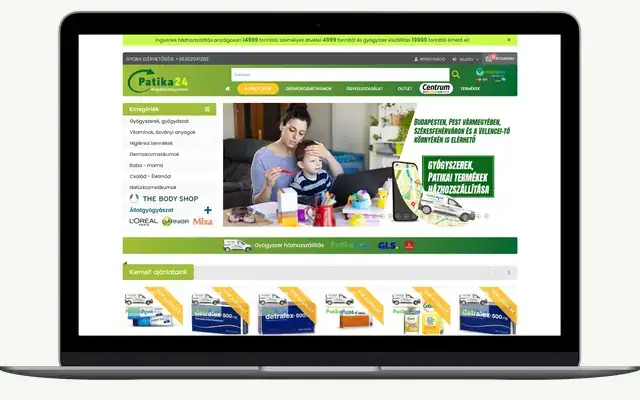

Patika24
65% revenue growth in a year, with 8% cheaper clicks
Case study →
Extreme Digital
The savings on day one covered the agency fee for months
Case study →“They have run our Facebook and Google campaigns for more than 7 years. No matter how ambitious the targets we set, they beat them. They constantly look for and test new digital solutions, which is how we keep our edge over the competition.”